By: Marcus J. Hopkins, Guest Contributor
The National Alliance of State and Territorial AIDS Directors (NASTAD) has released its 2024 National RWHAP Part B ADAP Monitoring Project Annual Report documenting key trends, challenges, and successes faced by state and territorial AIDS Drug Assistance Programs (ADAPs). This report is developed using information provided to NASTAD by state and territorial ADAPs through information requests, and the 2024 report includes information from 49 states, the District of Columbia, and Puerto Rico. No fiscal or programmatic data were provided by West Virginia, the U.S. Virgin Islands, or the Pacific Island Jurisdictions, including American Samoa, Guam, the Northern Mariana Islands, the Marshall Islands, Palau, and the Federated States of Micronesia.
Key finding from this year’s report include:
- Ryan White Part B programs saw an increase of 1.6% in their Congressional appropriation from Fiscal Year (FY) 2021 to FY2022, from $1.27 billion to $1.29 billion, while ADAP-specific funding provided by the Health Resources Services Administration (HRSA) remained flat at $900m. As NASTAD notes, federal awards alone are not sufficient to meet the needs of Part B programs or their clients;
- Pharmaceutical rebates constituted the largest proportion of the overall ADAP budget for FY2022 at 47%, compared to federal ADAP earmark funding at 34% (Figure 1);
Figure 1 - Total ADAP Budget, By Source, FY1996–FY2022
 |
| Photo Source: NASTAD |
Note: Rebates are tracked separately from front-end discounts and account for both repayment to ADAP from a manufacturer for a drug expenditure and any additional savings generated.
Retrieved from National Alliance of State and Territorial AIDS Directors, 2024.
- Reporting ADAPs served a total of 235,615 clients in Calendar Year (CY) 2022, with California serving the most clients at 29,774;
- The percentage of ADAP clients served by ADAP-funded insurance programs increased from 42% in CY2021 to 44% in CY2022, matching for the first time the percentage of ADAP clients served by full-pay medication programs (also 44% in CY2022);
- The age demographics of clients served by ADAPs has shifted slightly as patients age, with clients aged 25-44 increasing from 39% to 40%, those aged 65+ increasing from 12% to 13% from CY2021 to CY2022. Adults aged 45-64 continue to represent the largest percentage of ADAP clients, at 44%, down from 46% in CY2021;
- A majority of the 51 ADAPs that provided information (34, n=67%) have opted to eliminate the six-month recertification requirement. The programs that have left that in place include: Alaska, Indiana, Kansas, Kentucky, Maryland, Massachusetts, Nevada, New Hampshire, North Carolina, Ohio, Oklahoma, Rhode Island, Texas, and Wyoming (NASTAD, 2024);
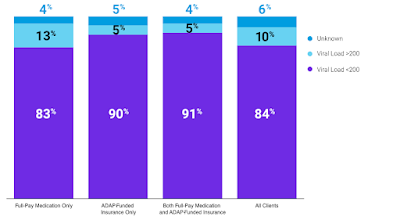
- 84% of clients served by the ADAPs achieved viral suppression of their HIV (i.e., they achieved viral loads of <200 replicating copies). Clients who received ADAP-funded insurance only or a combination of ADAP-funded insurance and full-pay medication program services were more likely to achieve viral suppression than those who received only full-pay medication program services (Figure 2).
Figure 2 - ADAP Clients Served by Program, by Viral Load, CY2022
 |
| Photo Source: NASTAD |
Note: Retrieved from NASTAD, 2024.
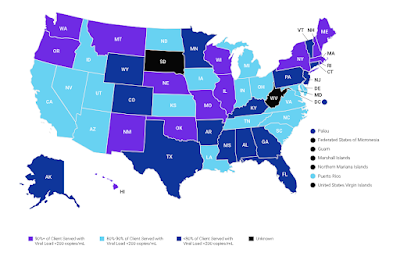
- 17 of the 51 responding ADAPs reported that less than 80% of their enrolled clients had achieved viral suppression—Alabama, Alaska, Arkansas, Colorado, Connecticut, the District of Columbia, Florida, Georgia, Kentucky, Minnesota, Mississippi, New Jersey, Palau, Pennsylvania, Texas, Vermont, and Wyoming (Figure 3).
Figure 3 - ADAP Viral load Suppression Rate, by Clients Served, CY2022
 |
| Photo Source: NASTAD |
Note: Retrieved from NASTAD, 2024.
Discussion
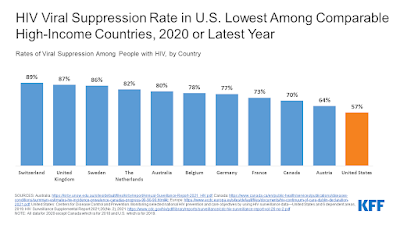
State and territorial ADAPs continue to serve as a vital component of HIV care and treatment in the United States, serving nearly a quarter-million Persons Living with HIV/AIDS (PLWHA). While the nation’s PLWHA population, as a whole, suffers from astonishingly low rates of HIV viral suppression, with just 57% of PLWHA achieving viral suppression—one of the lowest rates of viral suppression among comparable high-income countries (Figure 4).
Figure 4 - HIV Viral Suppression Rate in U.S. Lowest Among Comparable High-Income Countries, 2020 or Latest Year
 |
| Photo Source: KFF |
Note: Retrieved from KFF, 2022.
The consistent component of these comparable countries that PLWHA do not enjoy in the United States is that PLWHA enjoy Universal Healthcare coverage in each of them. The AIDS Drug Assistance Program is one of the few programs that provides relatively comprehensive medication coverage for PLWHA, and if the findings in the NASTAD annual report are any indication, the provision of those programmatic services is highly successful in helping patients achieve viral suppression compared to patients who are not beneficiaries of those services.
Each of these nations also provides significantly more permissive and generous social support systems that include relatively easily accessible housing, nutrition, and financial assistance programs, whereas PLWHA in the United States continue to face barriers to viral suppression.
Among adults who reported feeling that they did not receive enough HIV care, nearly all (95.6%) reported experiencing at least one barrier to accessing care and treatment, and nearly two-thirds (62.6%) reported more than one barrier (Dasgupta, Tie, Beer, Fagan, & Weiser, 2021). 50% of respondents in the Dasgupta study indicated having life circumstances that impeded their ability to access care, and 34.5% of those respondents indicated that they faced problems with money or insurance coverage.
It is further interesting that viral suppression rates amongst ADAP recipients in most of the Deep South fall below 80% of ADAP clients. There are several potential factors that may contribute to these lower levels of success among ADAPs, most of which have little to do with the programmatic services, themselves, including (but not limited to):
- The accessibility of HIV care and treatment providers local to patients, including hours of operations, proximity to patients, and the quality of care patients receive;
- A lack of reliable public or private transportation to and from appointments;
- Geographic or weather barriers that may make treatment inaccessible during storm seasons;
- Poverty-driven barriers, including unstable or unaffordable housing, the inability to afford food, or the inability to afford utilities that forces patients to choose between affording to live and affording medications.
Equally interesting are the low suppression rates of ADAP recipients in northeastern states, such as Connecticut, New Jersey, Pennsylvania, and Vermont, while every other surrounding state boasts suppression rates of 80% or higher, with Connecticut and Vermont surrounded by states boasting 90% suppression rates or higher.
It is possible that lower suppression rates in these states may be the result of transportation or accessibility issues, but patients in those states generally experience fewer physical and transportation barriers than those living in the Deep South, which tends to be more rural, have fewer and less accessible public transportation options, and higher patient-to-provider ratios compared to the northeast.
Finally, while it is normal for some jurisdictions to not respond to NASTAD’s annual survey requests, the Pacific Island Jurisdictions seem to almost never respond. An examination of NASTAD reports dating back to 2019 showed that Americans Samoa, the Federated States of Micronesia, Guam, Marshall Islands, Northern Mariana Islands, and the Republic of Palau have failed to respond to survey requests every year. While the footprint of ADAP in these territories is relatively small compared to the contiguous states and Puerto Rico, it is still vital that we be able to gain insight into the operations and efficacy of ADAP programs in those jurisdictions.
This issue is not unique to NASTAD. In attempting to gather timely data about programs in those territories, ADAP Advocacy has encountered similar challenges when attempting to access government websites, eligibility requirements, and contact information for the Pacific Island Jurisdictions.
ADAP Advocacy will continue to monitor state and territorial ADAP reports.
References:
Dasgupta, S., Tie, Y., Beer, L. Fagan, J., & Weiser, J. (2021, October). Barriers to HIV care by viral suppression status among US adults with HIV: Findings from the Centers for Disease Control and Prevention Medical monitoring project. Journal of the Association of Nurses in AIDS Care, 32(5): 561-568. https://doi.org/10.1097%2FJNC.0000000000000249
KFF. (2022, June 03). HIV viral suppression rate in U.S. lowest among comparable high-income countries, 2020 or latest year. San Francisco, CA: KFF: HIV/AIDS: Slide. https://www.kff.org/hivaids/slide/hiv-viral-suppression-rate-in-u-s-lowest-among-comparable-high-income-countries-2020-or-latest-year/
National Alliance of State and Territorial AIDS Directors. (2023). 2023 national RWHAP Part B ADAP monitoring project annual report: Section 3: Meeting the need: Ensuring access to essential medicines for People Living with HIV/AIDS. Washington, DC: National Alliance of State and Territorial AIDS Directors. https://nastad.org/2023-rwhap-part-b-adap-monitoring-report/section-3
National Alliance of State and Territorial AIDS Directors. (2024). 2024 national RWHAP Part B ADAP monitoring project annual report. Washington, DC: National Alliance of State and Territorial AIDS Directors. https://nastad.org/2024-rwhap-part-b-adap-monitoring-report
National Alliance of State and Territorial AIDS Directors. (2024). 2024 national RWHAP Part B ADAP monitoring project annual report: Section 1. Washington, DC: National Alliance of State and Territorial AIDS Directors. https://nastad.org/2024-rwhap-part-b-adap-monitoring-report/section1
National Alliance of State and Territorial AIDS Directors. (2024). 2024 national RWHAP Part B ADAP monitoring project annual report: Section 2: Meeting the need: Ensuring access to essential medicines for People Living with HIV/AIDS. Washington, DC: National Alliance of State and Territorial AIDS Directors. https://nastad.org/2024-rwhap-part-b-adap-monitoring-report/section2
Disclaimer: Guest blogs do not necessarily reflect the views of the ADAP Advocacy Association, but rather they provide a neutral platform whereby the author serves to promote open, honest discussion about public health-related issues and updates.
No comments:
Post a Comment